Web Dashboard
The web interface provides a real-time view of your study’s randomization status. After logging in with your Google account, you are redirected to the Participants dashboard.
Dashboard
The dashboard is divided into several sections:
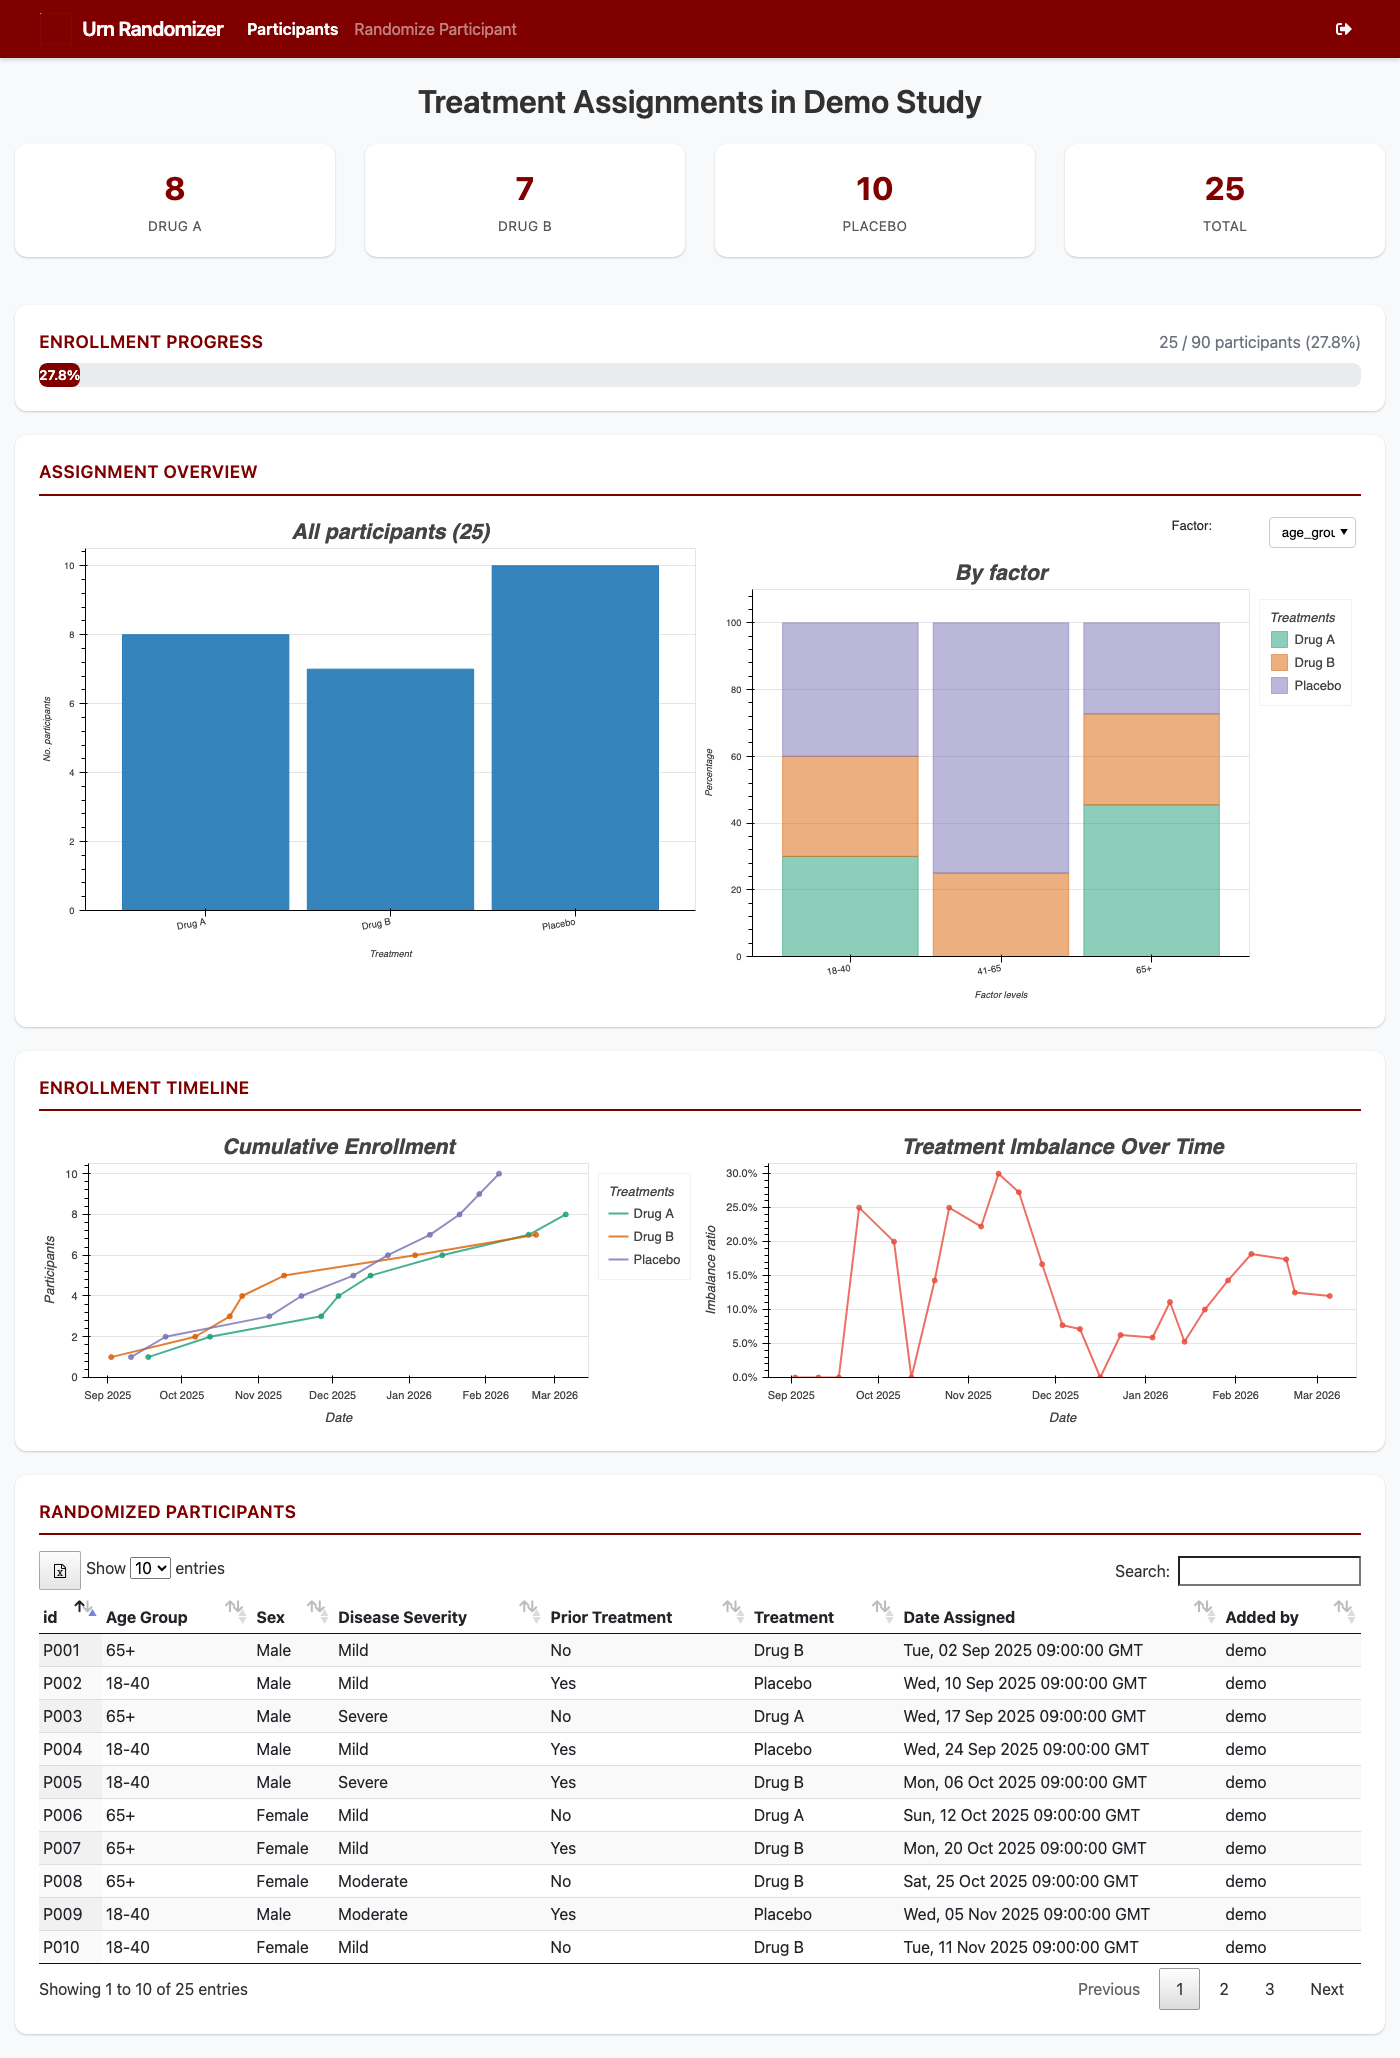
Fig. 2 The Participants dashboard showing all monitoring sections.
Summary Cards
At the top of the page, cards display the current count of participants assigned to each treatment arm, plus the overall total. These update automatically as new participants are randomized.
Enrollment Progress
When a target_enrollment is set in the configuration file, a progress
bar shows how enrollment is tracking against the target.
Assignment Overview
Two interactive Bokeh charts provide a visual breakdown:
All participants — a bar chart showing treatment counts across all strata.
By factor — a stacked bar chart that can be filtered by any prognostic factor using the dropdown selector.

Fig. 3 Treatment assignment counts across strata.
Enrollment Timeline
Two time-series charts show how the study has progressed:
Cumulative Enrollment — a line per treatment arm showing the running total of assignments over time.
Treatment Imbalance Over Time — the ratio of participants in each arm, helping identify drift from balance.
Participant Table
A searchable, sortable DataTable lists every randomized participant with their factor levels, assigned treatment, and timestamp. Use the Excel button to export the full dataset.
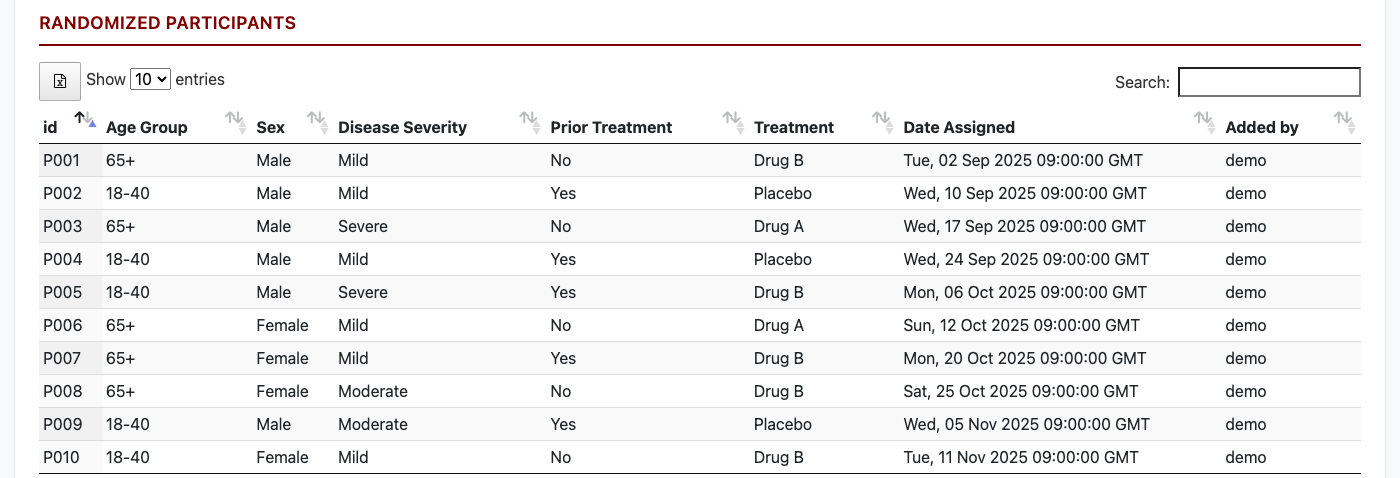
Fig. 4 The participant table with factor levels, treatment, and timestamps.
Randomizing a Participant
Click Randomize Participant in the navigation bar. Fill in the participant ID and select the appropriate level for each prognostic factor, then click Submit.
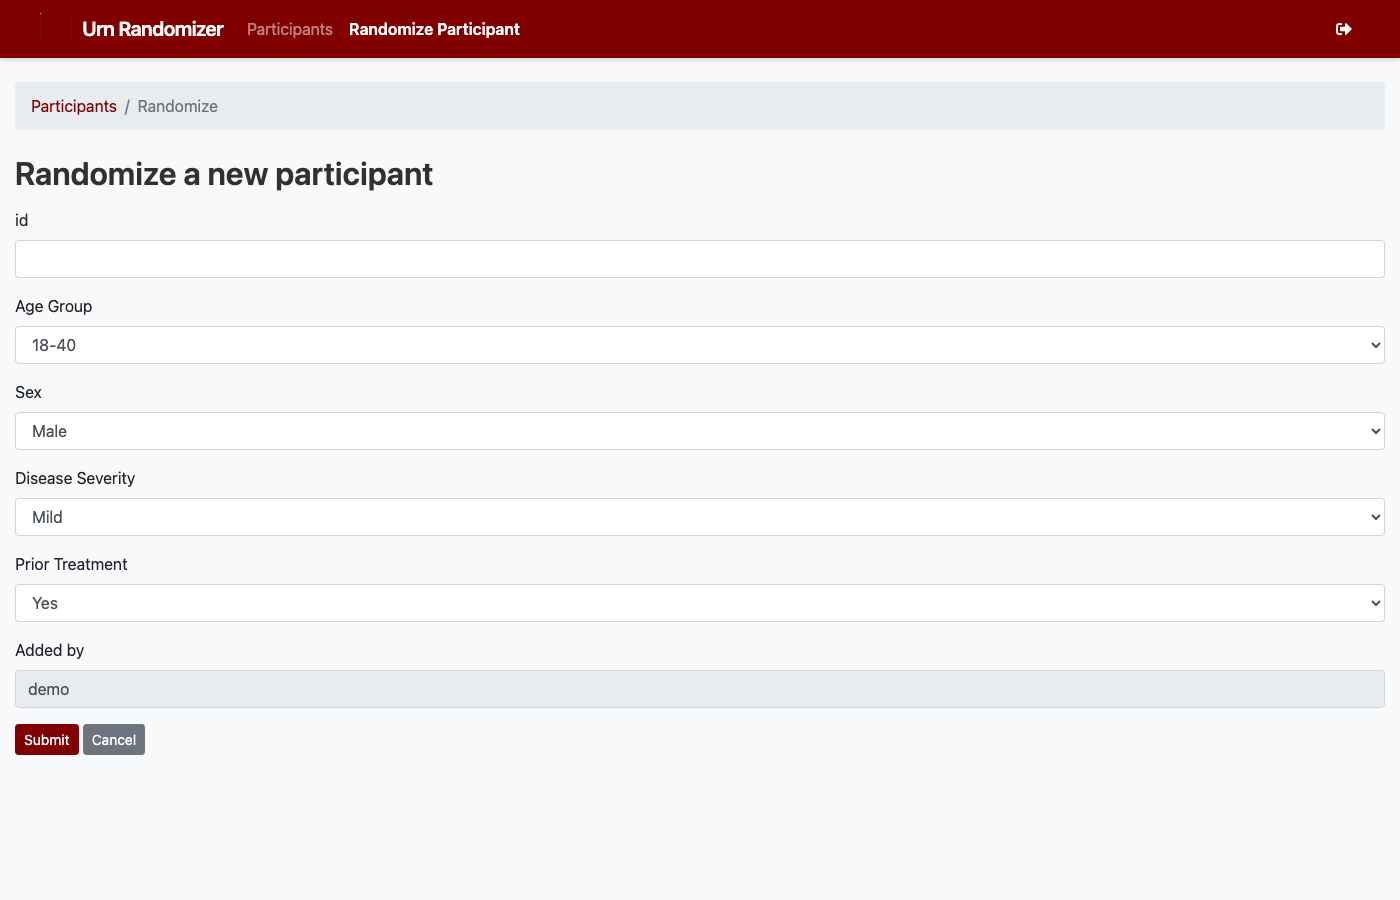
Fig. 5 Enter factor levels and submit to receive a treatment assignment.
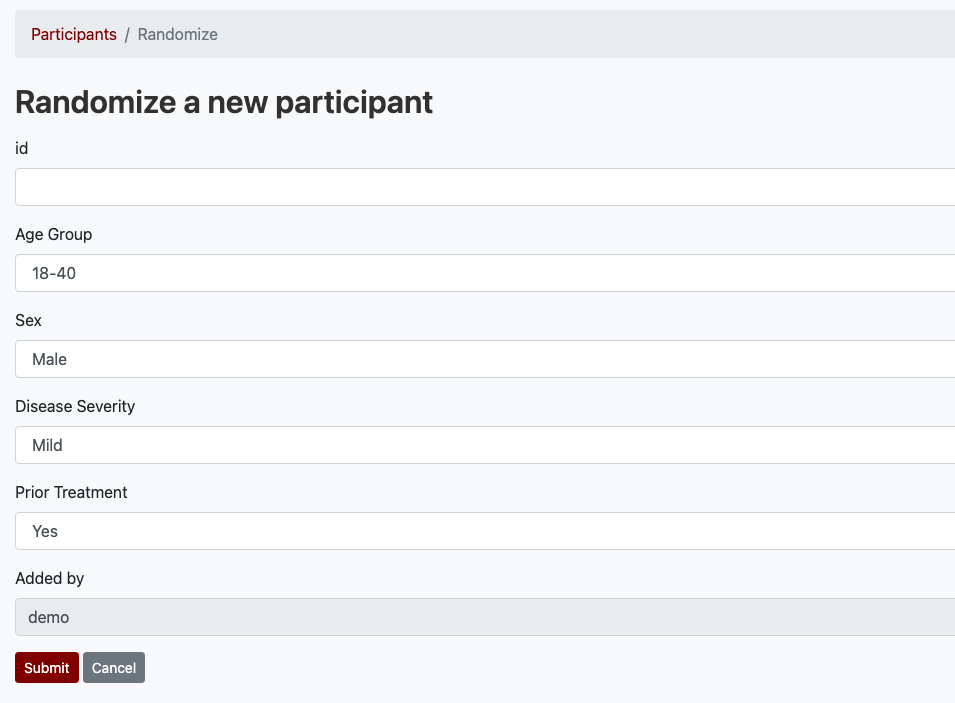
Fig. 6 A completed form showing the treatment assignment result.
The assigned treatment arm is displayed as a flash message at the top of the page, and the participant appears immediately in the dashboard table.
Authentication
Authentication to the web interface is handled via OAuth 2.0 with Google. Users log in with their Google account. An administrator must register each user’s email address beforehand using the CLI:
flask add_user johndoe john@example.com